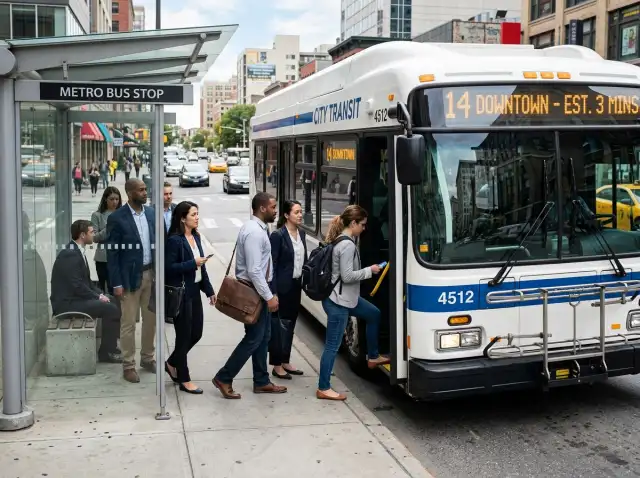
The Ridership Problem Is Real — and Persistent
Despite significant federal investment through programs like the Infrastructure Investment and Jobs Act and continued formula funding from the Federal Transit Administration (FTA), many transit agencies across the United States continue to see bus ridership well below 2019 benchmarks. The American Public Transportation Association (APTA) reported in its 2024 Public Transportation Fact Book that bus trips accounted for the largest share of unlinked passenger trips nationally, yet remained the mode most vulnerable to ridership loss. Understanding what drives a person to choose — or avoid — the bus is essential to reversing this trend.
The Frequency vs. Coverage Debate
One of the most fundamental tensions in bus network design is the trade-off between frequency and coverage. Frequency refers to how often buses run on a given route; coverage refers to how broadly the network reaches across a service area. Most transit agencies operate under budget constraints that force a choice: run buses more often on fewer routes, or spread service thinly across more of the community.
Transit planning consultant Jarrett Walker, whose work is widely cited by agencies and the FTA, has argued extensively that frequency is the single most important driver of ridership on fixed-route transit. His framework, articulated in Human Transit and applied in network redesigns in cities such as Houston, Columbus, and Richmond, holds that people will not plan their lives around a bus that comes every 60 minutes. A service frequency of 15 minutes or better — sometimes called "frequent network" threshold — fundamentally changes who will consider taking the bus.
However, coverage has its own equity logic. Elected officials and community advocates often resist eliminating low-ridership routes because they serve essential-trip riders — people who have no other option. The Federal Transit Administration requires agencies receiving federal funds to conduct equity analyses under Title VI of the Civil Rights Act, which complicates purely ridership-maximizing approaches. The productive resolution is not to pick one value absolutely, but to be explicit about what percentage of service hours are devoted to ridership versus coverage goals — a framework Houston METRO applied in its 2015 redesign and has since been replicated in whole or in part by dozens of peer agencies.
Reliability: The Trust Factor
Even if a route runs frequently, unreliable service destroys ridership. A bus scheduled every 12 minutes that actually runs every 8 minutes on some days and every 25 on others creates what transit researchers call "schedule uncertainty" — a hidden cost that causes discretionary riders to abandon the system. The Texas A&M Transportation Institute's Urban Mobility Report has consistently shown that unpredictability in travel time is more damaging to mode choice than average travel time itself.
Improving reliability typically requires a combination of operational tools: transit signal priority (TSP), dedicated bus lanes, all-door boarding to reduce dwell time, and real-time data-sharing with passengers. Agencies that have invested in these tools — including Los Angeles Metro and Denver RTD — have documented measurable improvements in on-time performance. Critically, reliability gains must be communicated to riders; a bus that is now running on time does not automatically rebuild trust if passengers do not know the system has changed.
Safety Perception vs. Actual Safety
Perceptions of safety on public transit — both personal security and traffic safety at stops — rank consistently high among the reasons non-riders cite for avoiding the bus. This is true even in cities where crime statistics on transit do not objectively justify the fear. A 2023 survey conducted by the Transit Center found that approximately 40 percent of non-riders in major U.S. metros listed personal safety concerns as a reason they would not consider using transit regularly.
The gap between perceived and actual safety requires a dual response. On the actual safety side, agencies can invest in better stop infrastructure (lighting, shelter, sight lines), coordinate with law enforcement or social service outreach teams to reduce visible disorder, and use data to identify hotspot times and locations. On the perception side, agencies must communicate safety improvements proactively — through rider testimonials, independent reporting of incident data, and physical improvements that signal investment and care. A well-lit, clean stop with real-time arrival information sends a signal about the system's overall quality before a passenger even boards.
Fares: Price, Complexity, and Friction
Fare policy is both a ridership tool and an equity instrument. Research from the Urban Institute and multiple academic studies has consistently shown that fare elimination (free transit) produces measurable ridership gains, particularly among low-income riders. Several U.S. cities — including Kansas City, Missouri; Olympia, Washington; and Raleigh, North Carolina — have experimented with fare-free bus service with generally positive ridership outcomes, though the sustainability and cost-effectiveness of full fare elimination remains debated.
Even for agencies that cannot eliminate fares, reducing fare complexity and payment friction matters enormously. The requirement to have exact change, the lack of mobile payment options, or the absence of a day-pass or income-based fare program all add barriers that suppress ridership among occasional and potential riders. The TransitCenter has documented that agencies offering capped daily fares and integrated mobile ticketing see measurable reductions in boarding times and increases in ridership among choice riders.
Information: You Cannot Ride What You Cannot Find
A persistent and underappreciated barrier to ridership is simply information — or the lack of it. Many potential riders do not use the bus because they do not know how to use it: where to board, how to pay, where a route goes, or how to transfer. This is particularly true for immigrants, seniors, and people with disabilities, but it affects the general public more broadly than agencies often acknowledge.
High-quality passenger information includes legible system maps, stop-level schedules, real-time arrival displays (at stops and on mobile apps), multilingual materials, and wayfinding that connects the bus stop to adjacent destinations. The American Public Transportation Association (APTA) has published best-practice guidelines for passenger information systems, emphasizing that information quality is directly linked to first-time ridership conversion and retention. Trip-planning integrations with tools like Google Maps and Apple Maps have become table stakes for reaching younger and tech-comfortable demographics.
The Missing Input: Why Aren't People Riding?
Here is where many agencies make a critical error: they design ridership-building strategies without systematically asking non-riders why they do not use the bus. Rider surveys are relatively common; non-rider surveys are not. Yet the two populations have fundamentally different profiles and different barriers. A rider survey tells you how to serve people you already have. A non-rider survey tells you how to grow.
Non-rider research typically reveals a hierarchy of barriers that does not match agency assumptions. While agencies may assume that non-riders are primarily deterred by travel time or route coverage, survey data from cities as varied as Seattle, Atlanta, and Minneapolis has found that lack of information, safety perception, and schedule unreliability rank as high or higher than coverage gaps. The FTA's Circular on Title VI compliance encourages, but does not mandate, non-rider surveying as part of service planning. Forward-thinking agencies — including Sound Transit in Washington state and the Chicago Transit Authority — have incorporated structured non-rider research into their strategic planning cycles.
The methodology matters too. Intercept surveys at transit stops will not reach non-riders by definition. Effective non-rider research requires random telephone or address-based sampling, online panels with demographic quotas, or partnerships with community organizations that have trust relationships with underserved populations. The investment is modest relative to the strategic value of the insight.
Where TIPS Fits In
The Transit Information and Planning System (TIPS) framework supports the kind of integrated, data-driven planning that ridership growth requires. By enabling agencies to collect, organize, and act on both operational data and community input — including structured non-rider feedback — TIPS helps close the loop between what an agency thinks is happening and what riders and non-riders actually experience. From route performance analytics to passenger information deployment, a well-implemented TIPS environment gives transit planners the evidence base they need to make defensible, equity-conscious decisions about frequency, coverage, fares, and communications — without relying on assumptions that may be years out of date.
Summary: Ridership Growth Requires Multiple Levers, Pulled Together
There is no single answer to the question of how to get more people to ride the bus. Frequency matters, but only if the routes people need are covered. Coverage matters, but only if service is reliable enough to be trusted. Reliability matters, but only if passengers know about it. Fares matter, but affordability must be matched with simplicity. Information matters, but it must reach the right audiences in the right languages and channels. And all of these interventions will be better targeted if agencies invest in understanding — through rigorous survey data — why their non-riders are staying away. Transit agencies that treat ridership growth as a systems challenge, rather than a marketing problem, are the ones seeing sustained gains. The evidence, the tools, and the frameworks exist. The missing ingredient, in too many places, is the discipline to use them together.
References
- American Public Transportation Association (APTA) — Public Transportation Fact Book, 2024
- Federal Transit Administration (FTA) — Transit.dot.gov
- TransitCenter — Research and Publications on Transit Ridership and Equity
- Urban Institute — Transportation and Housing Research
- Texas A&M Transportation Institute — Urban Mobility Report
- Walker, Jarrett. Human Transit: How Clearer Thinking about Public Transit Can Enrich Our Communities and Our Lives. Island Press, 2011.